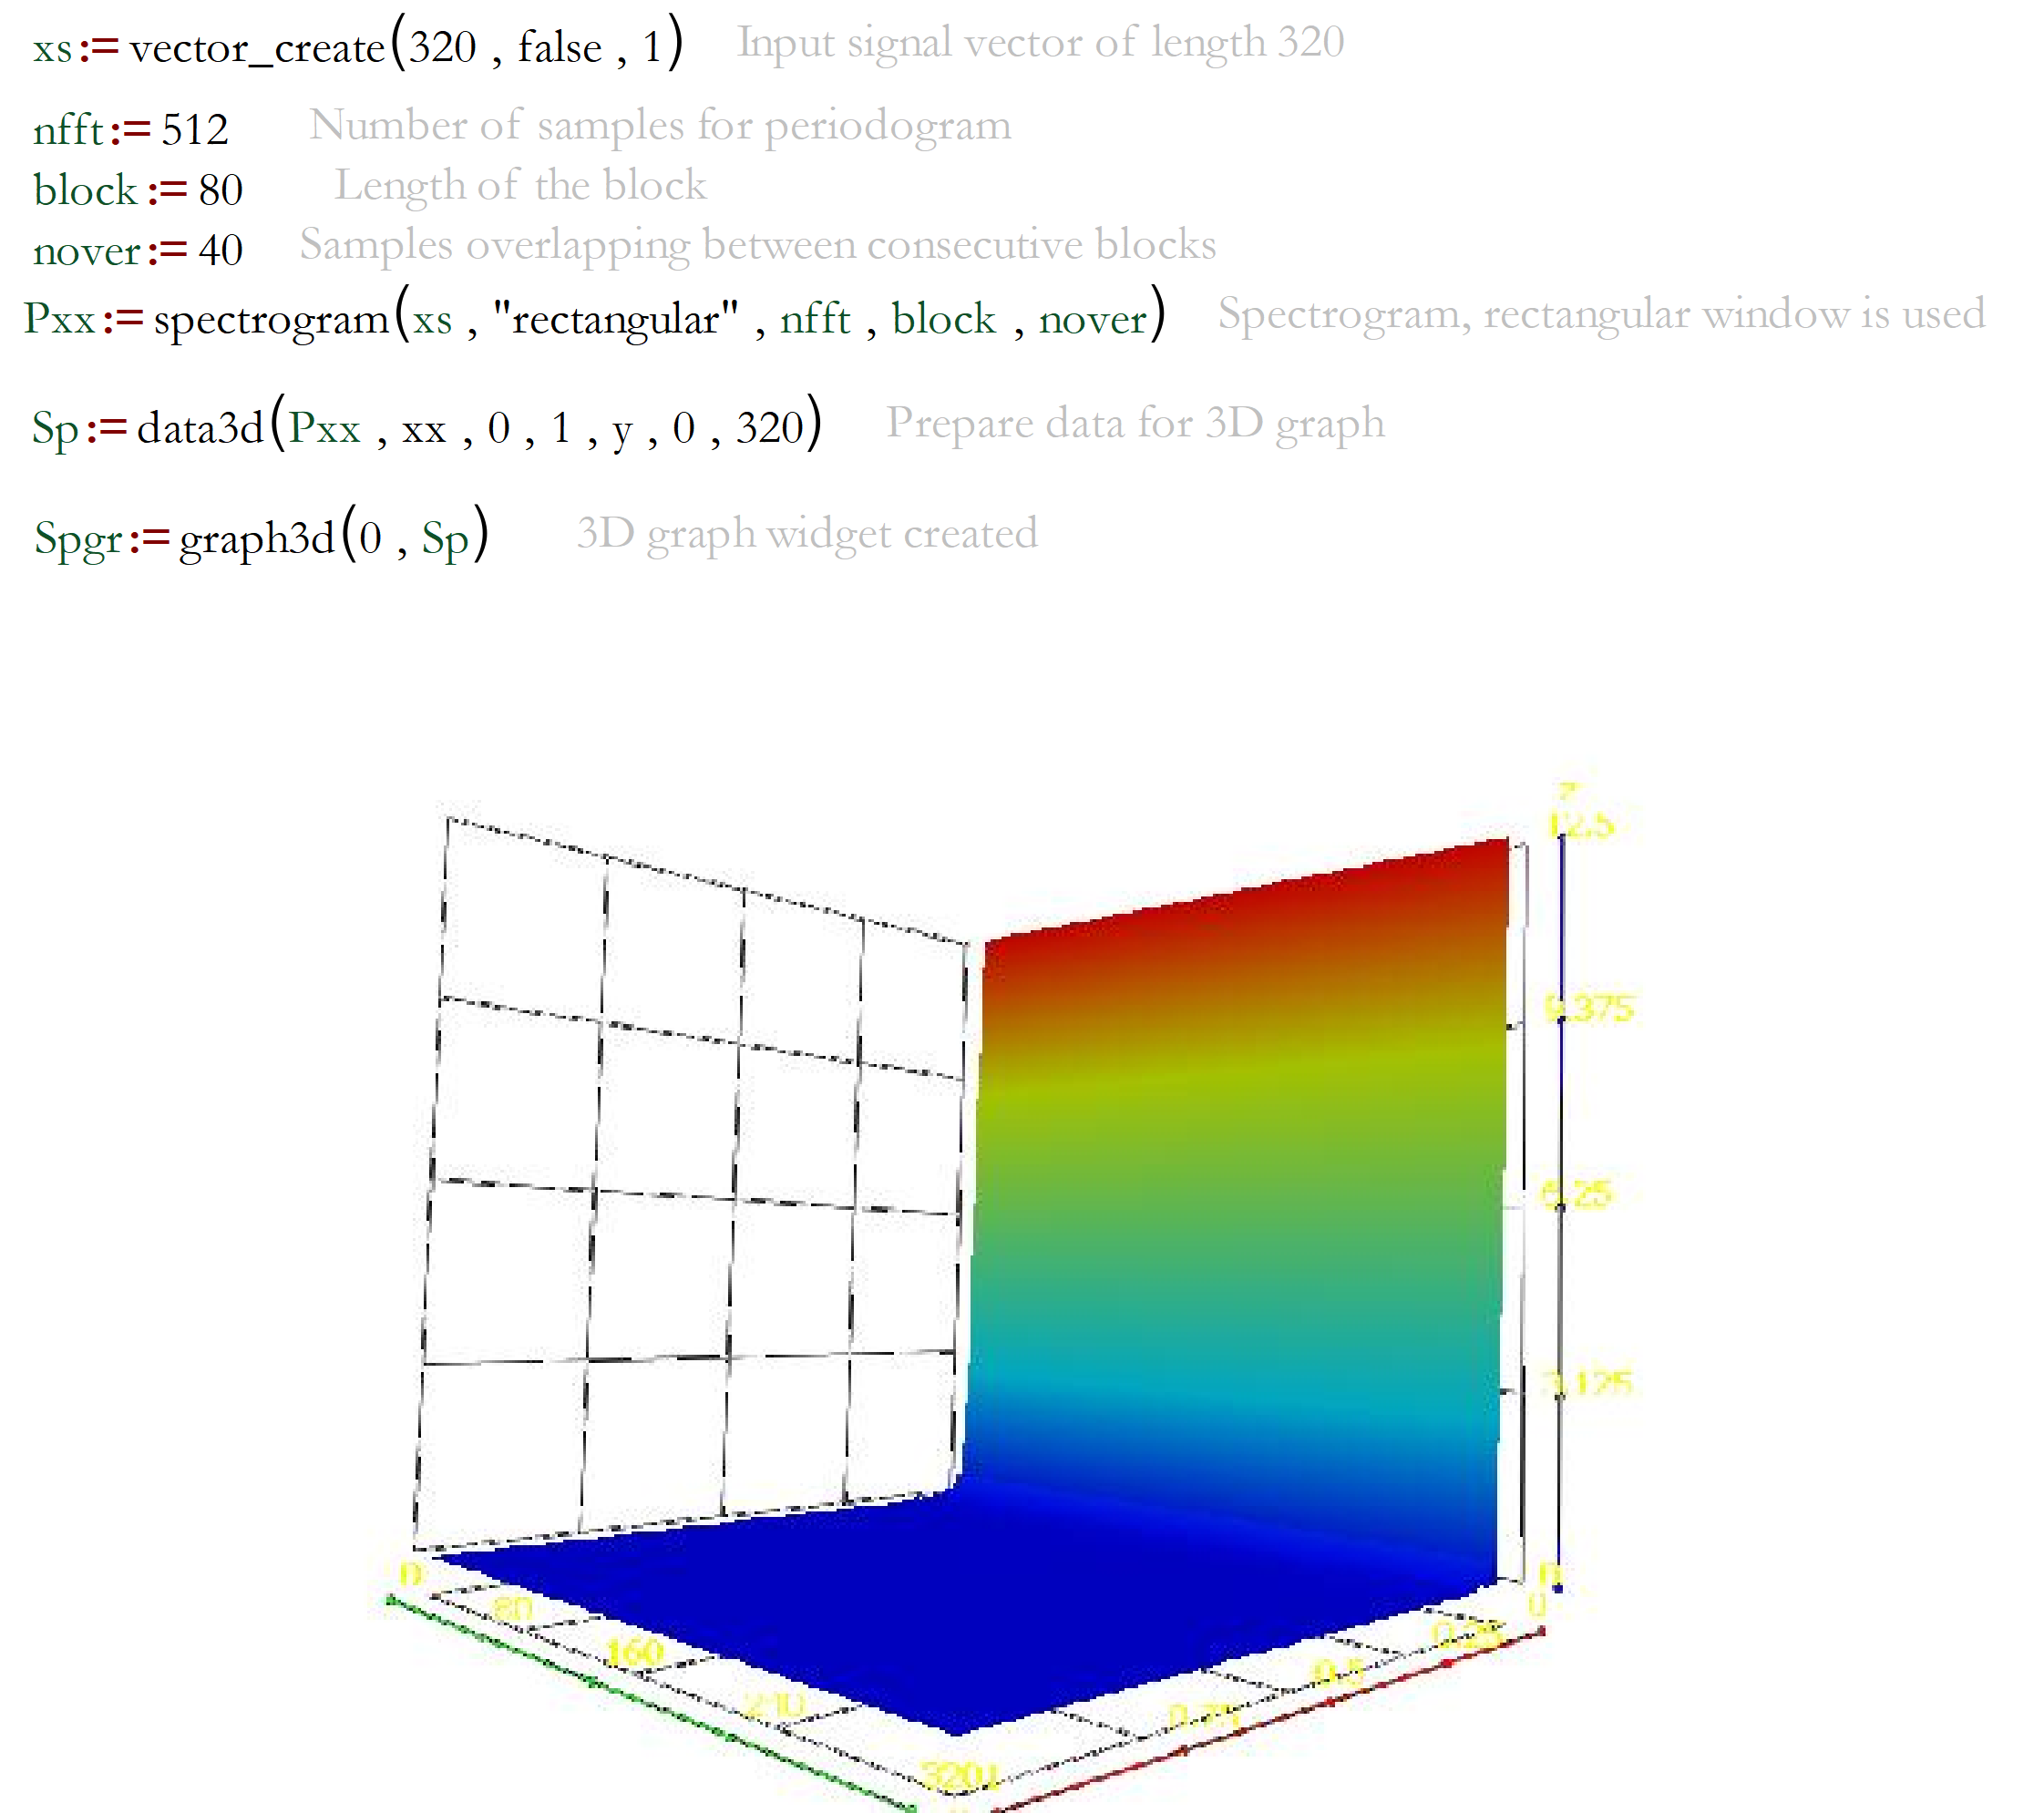
Spectral Analysis Toolkits
Spectral analysis answers how the power of a signal is distributed across frequency. The fast Fourier transform is the computational core, but a raw FFT of a finite record is a noisy and biased estimate of that distribution, which is why the toolkit exposes windowing, averaging and scaling as first-class settings.
Window choice sets the trade-off between resolution and leakage. A rectangular window gives the narrowest main lobe and the worst sidelobes; Hann and Blackman widen the main lobe in exchange for far lower leakage. When two nearby tones differ greatly in amplitude, that choice decides whether the weaker one is visible at all.
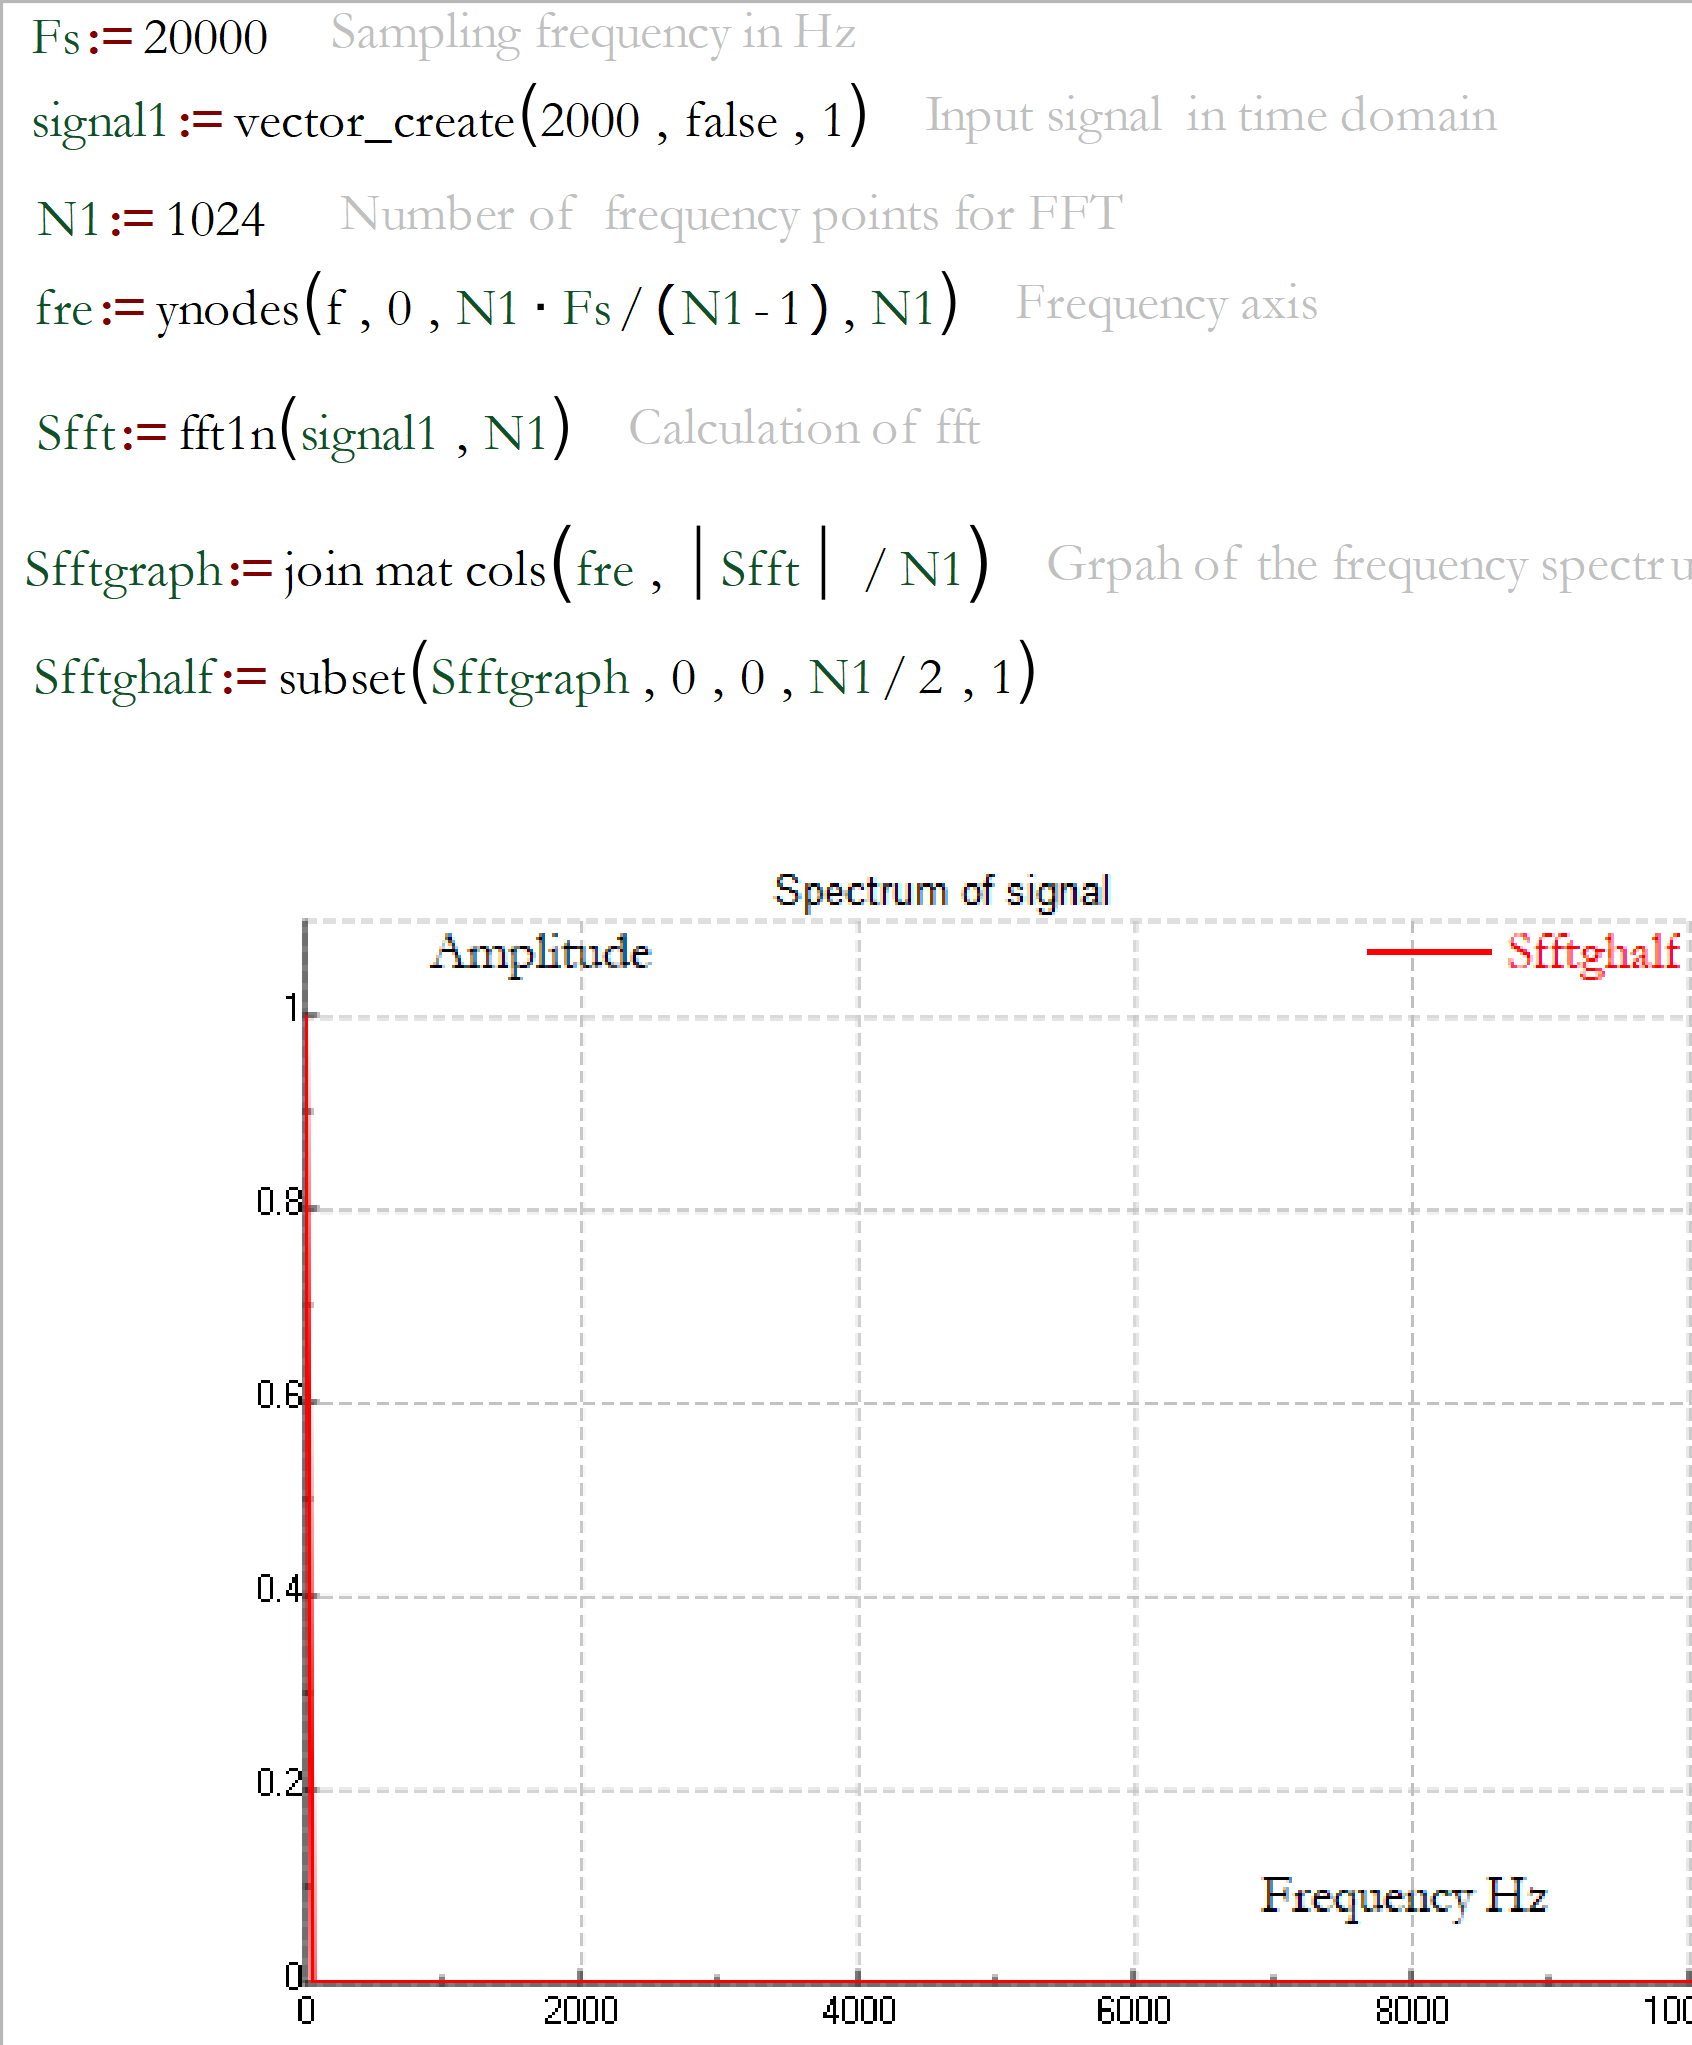
Averaged estimators
Splitting a record into overlapping segments, transforming each and averaging the results reduces the variance of the estimate at the cost of frequency resolution. The Welch and Bartlett estimators in the toolkit implement this directly, with segment length, overlap and window under explicit control.
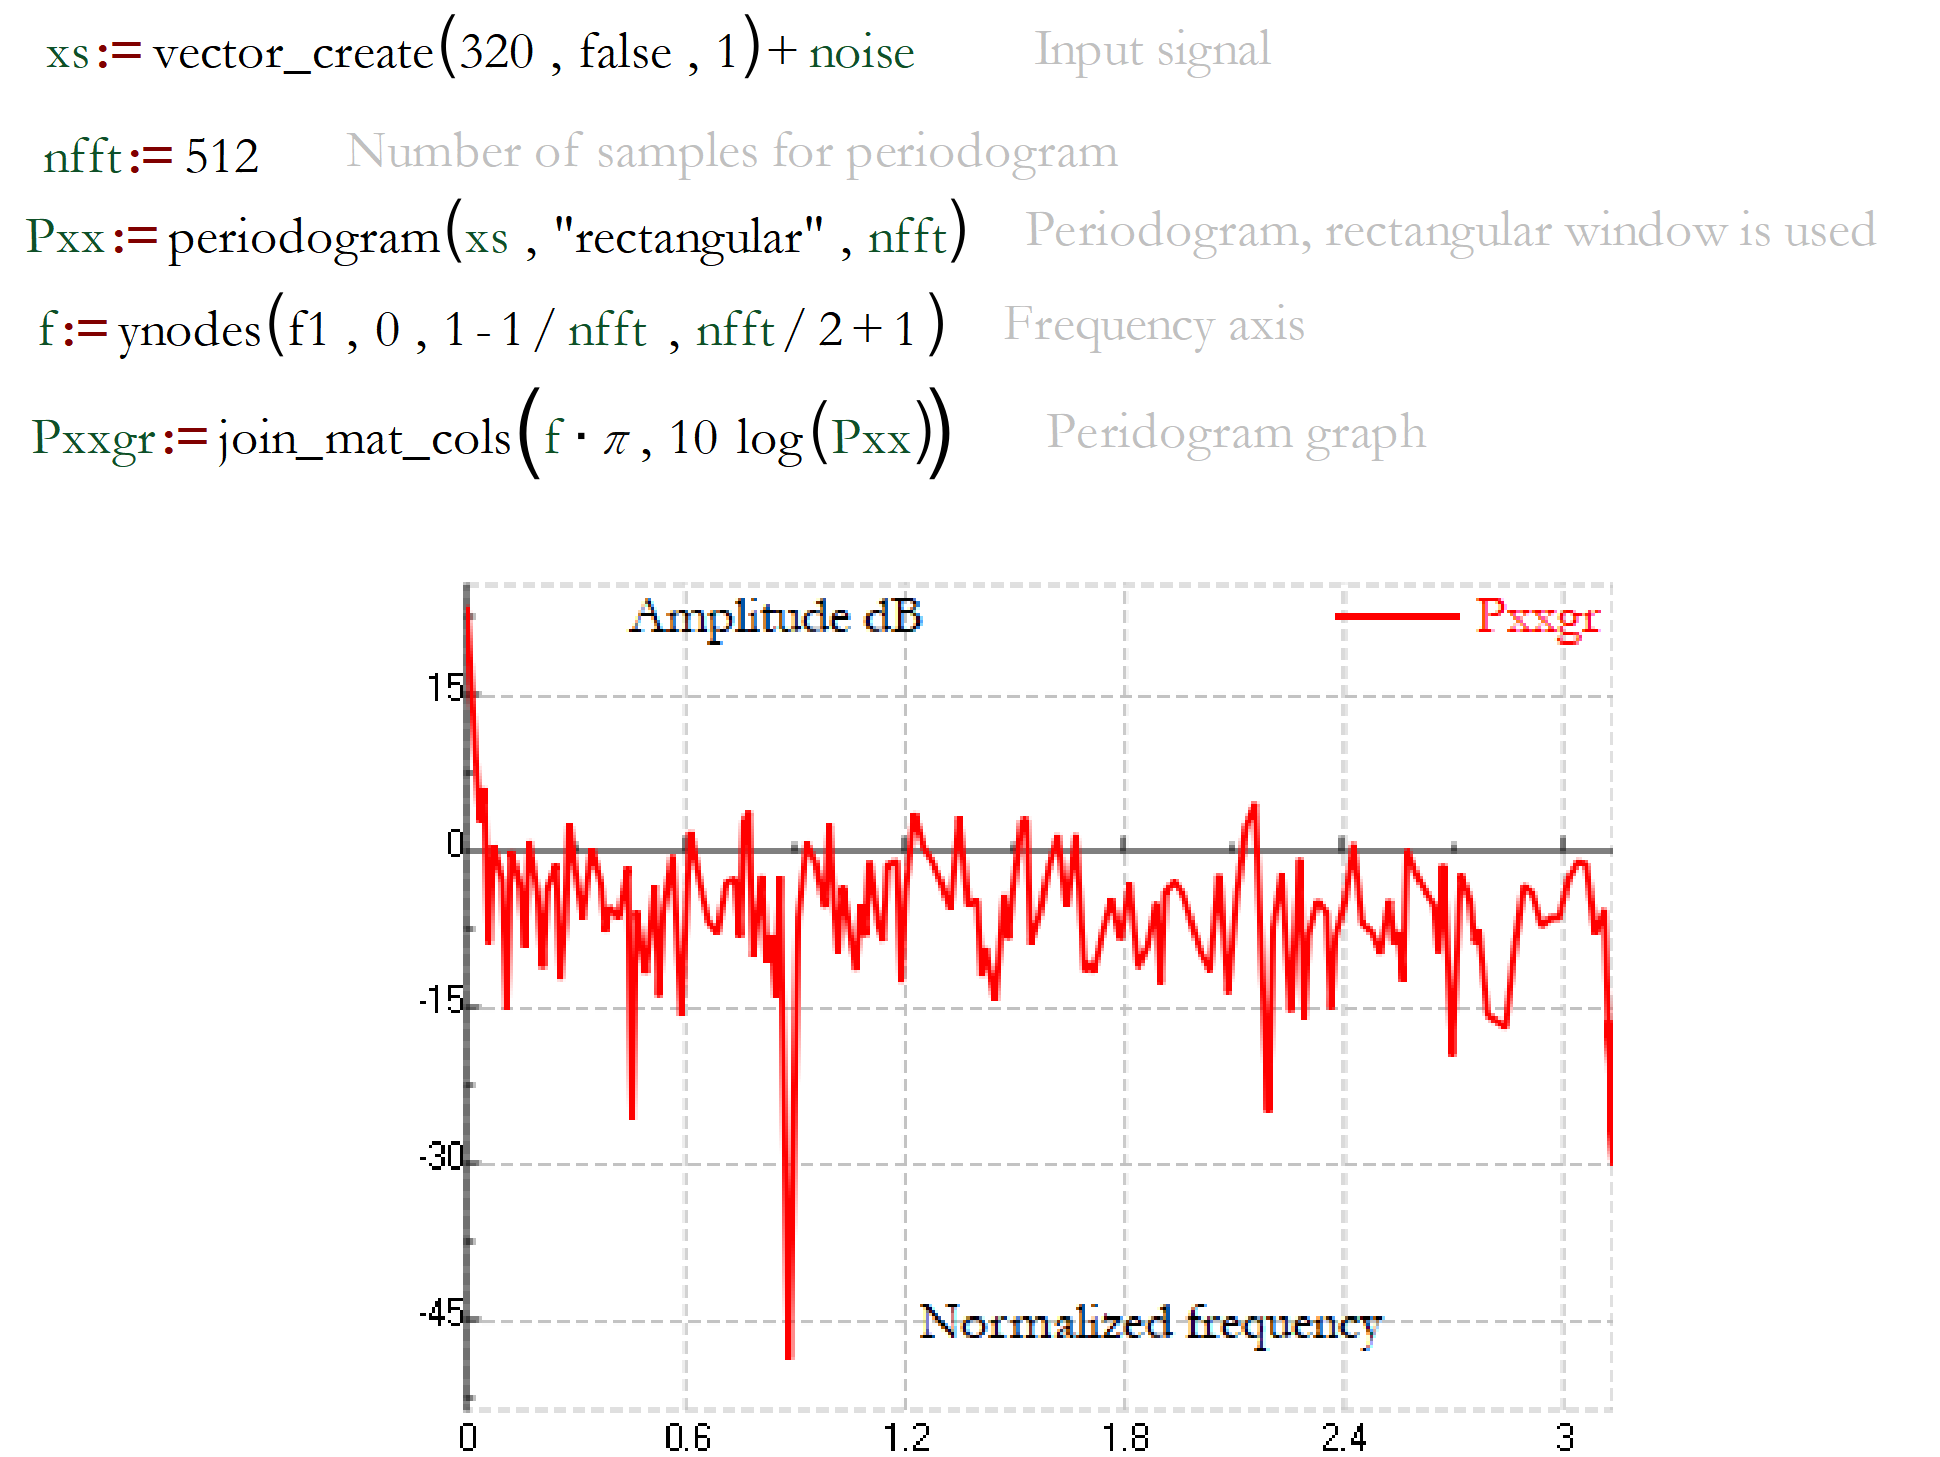
Time-varying spectra
A single spectrum assumes the signal statistics do not change over the record. When they do, the short-time Fourier transform is applied instead: the signal is cut into short frames and each is transformed, producing a spectrogram in which frequency content is plotted against time.
Frame length is the central compromise. Short frames resolve fast events but blur frequency; long frames resolve frequency but smear events in time. For signals where no single frame length works, the Wavelet Analysis Toolkit offers a multiresolution alternative.